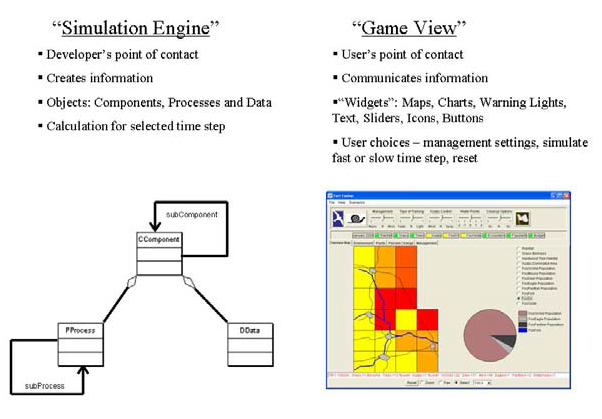
 The entire QnD system is coded in the Java language and is a combination of original code and open source libraries/application programming interfaces (API’s). QnD is divided into two parts: the Simulation Engine and the Game View. Each part has a primary objective to either create information or to communicate information to the users. The Simulation Engine works to synthesize the various data and systems concepts into useful constructs that can provide systematic calculations and information in a modular and quickly-altered platform. The Game View allows users to see the system in more graphical (less number-based) methods and to implement management options in a simplified way.
Simulation Engine Desing
The primary element for creating a simulation engine is through the deployment of component, process and data objects. These objects in QnD are arranged in several packages:
• Components Package: CComponents object defines the DData, CComponents and PProcess storage in Hashmaps, CHabitat object moves the CLocalComponents into the Habitat, CLocalComponent object describes the LocalComponent, CScenario object defines the Scenarios and finally CSpatialUnit object defines the link between components and processes;
• Control Package: Objects here are used mostly in the background and thus do not have the “C, P, D” typology of the SimulationEngine objects. The GameDriver object acts as a main simulator object to coordinate both the GameView and SimulationEngine. The PrimaryGameFrame object provides the main GameView frame. Both of these control objects utilize various factory-style objects (QnDModelCreator and qndMngReader) to read XML input and time series files and to create the various constituent objects;
• Data Package: Objects in this package establish the data and drivers;
• Exception Package: This package contains different types of exception objects that QnD can show;
• Processes Package: It contains all the PProcesses objects and SubProcesses.
Game View Desing
The Game View constitutes what a “player” sees and reacts to with the various management options in the player’s world. Each game view is made of a map viewer (GeoToolsLite API), scrolling time series charts (Chart2D API), warning lights and management selection widgets.
The game view has several types of outputs that can be configured by the user via XML (eXtensible Markup Language) file inputs. By presenting the outputs in a selectable form, the QnD system allows users to choose how they want to see their output, including the following output options:
• Geographic Information System (GIS) maps that are updated on each simulated time step;
• Mouse-activated charts and text for individual spatial areas (pie charts and text line descriptions);
• Warning lights that change at user-selected critical levels;
• Scrolling time-series charts (listed on user-defined, tabbed pages);
• User-defined, text output files in comma separated format.
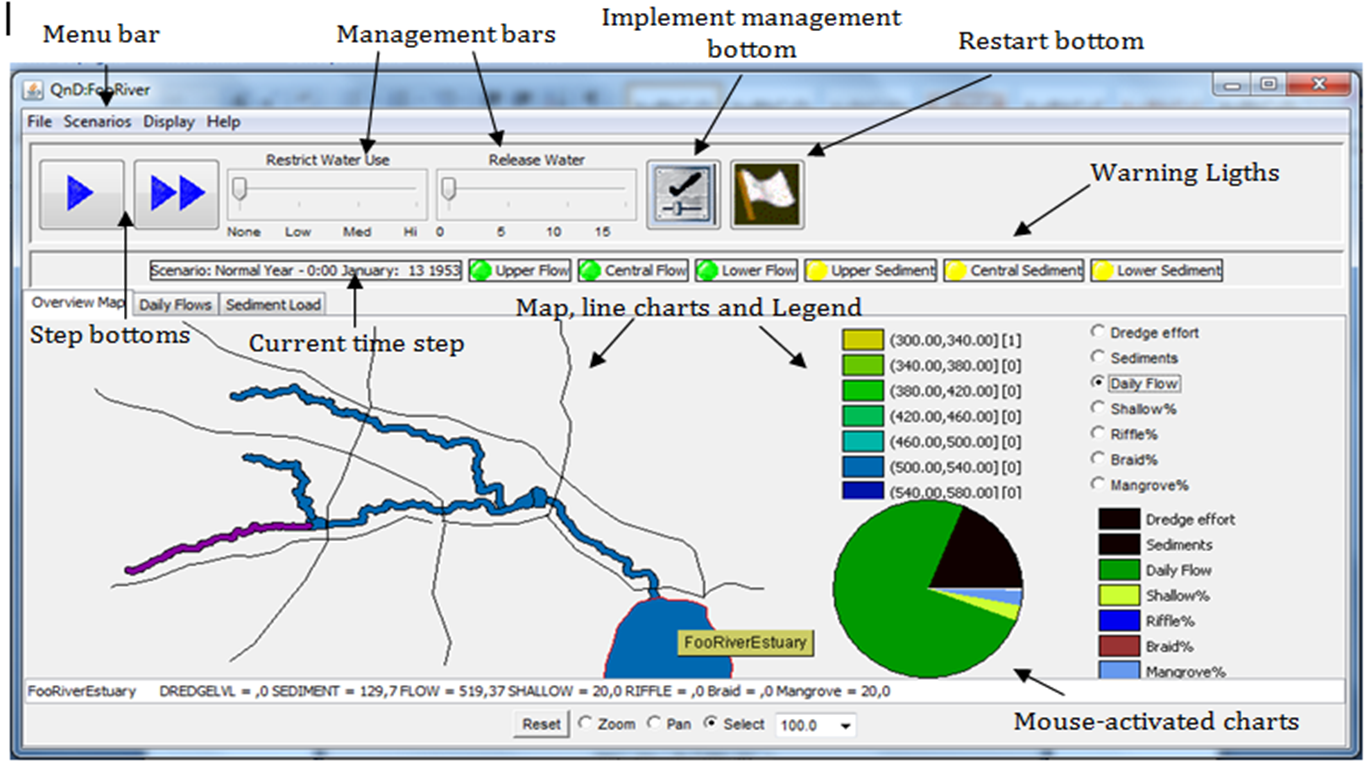
The QnD Graphical User Interface has been designed to select the scenario, time steps and management options of the simulation, as well as display the different outputs. Some bars and bottoms can be found:
• A menu bar, where previous project can be open or new project can be created, different scenarios can be selected and display options can be changed;
• A management bar, where options management can be changed;
• Implement management and restart bottoms, in order to implement the management settings and restart to the scenario conditions;
• Warning light that change at user-selected critical levels related to a variable. It shows the state of the system at the current time, regarding to a threshold;
• Map, line charts and color legend, which shows DData objects that are spatially explicit. DData objects can be rendered into both collective maps (selected by radio buttons) or line chart.
• Mouse-activated charts and text for individual spatial areas (pie charts and text line descriptions).

